اگر فایل یا کتابی رو که میخواهید توی سایت نیست روی " پیشنهاد فایل " کلیک کنید.



خرید و دانلود نسخه کامل کتاب Exercises and Projects for The Little SAS Book, Sixth Edition
قیمت اصلی 4,317,300 تومان بود.3,862,300 تومانقیمت فعلی 3,862,300 تومان است.

خرید و دانلود نسخه کامل کتاب Ultimate Step by Step Guide to ChatGPT Using Python: 90 Day Plan to Make Passive Income with Generative AI (Ultimate Step by Step Guide to Machine Learning Book 4)
قیمت اصلی 1,072,500 تومان بود.617,500 تومانقیمت فعلی 617,500 تومان است.
📥 ترافیک اینترنت مصرفی جهت دانلود فایلها در میکی بوک، بهصورت نیمبها می باشد.
📥 فقط اینقدر زمان داری با تخفیف بخری 👇
فرصت محدود برای خرید این محصول با قیمت ویژه
08
ساعت
:
45
دقیقه
:
40
ثانیه
-18%
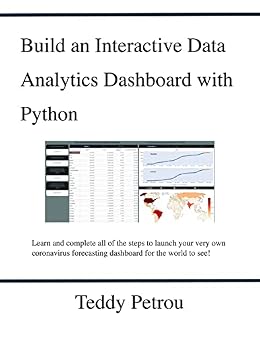
خرید و دانلود نسخه کامل کتاب Build an Interactive Data Analytics Dashboard with Python: Learn all of the steps to build a coronavirus forecasting dashboard using Python
قیمت اصلی 2,548,000 تومان بود.2,093,000 تومانقیمت فعلی 2,093,000 تومان است.
تعداد فروش: 66
نویسندگان: Teddy Petrou
فرمت: Original PDF صفحات: 210 pages تاریخ انتشار نسخه الکترونیکی : November 21, 2021
؟
لینک: https://www.amazon.com/dp/B09MDG77TM
زمان تحویل: حداکثر 24 ساعت
1
آیتم فروخته شده در 30 دقیقه
3
نفر در حال مشاهده این محصول هستند!
توضیحات
This book teaches you all of the skills to build interactive data analytics dashboards with Python. Specifically, you will be building a Coronavirus Forecasting Dashboard that shows historical and predicted values for deaths and cases for all countries in the world and US states during the ongoing coronavirus pandemic. The final product will be a live dashboard, automatically updated daily, hosted on a remote server for anyone, anywhere in the world to see!You will learn and complete the entire process for building the dashboard including the following topics:Getting, Cleaning, and Transforming the Data – You will learn how to collect the data, find and clean bad data, and transform it so that it can be used for building models capable of prediction.Data Smoothing – You will learn several different techniques such as LOWESS to smooth the jagged raw data so that the model can better detect trends.Exponential Growth and Decline Models – You will begin modeling coronavirus cases for each area of the world with these simple models that can capture a single exponential growth or decline phase, but not both.Logistic Growth Models – You will learn about a separate class of “S-Curve” models capable of capturing both exponential growth and decline in the same model.Modeling New Waves – Coronavirus cases appear in waves over different time periods. You will learn how to change your model so that it can detect any number of new waves in the future.Encapsulation into Classes – After selecting your model, you will encapsulate all of the code together into Python classes, eventually to be used in your final production code.Visualizations with Plotly – You will learn how to use the Plotly Python library to create interactive data visualizations targeted for the webHTML and CSS – You are building a web application and will learn the fundamentals of HTML and CSS to help add customization with the help of Dash.Building the Dashboard with Dash – You will learn how to build all of the components and interactivity of the dashboard with the Dash Python library.Deployment – One of the most exciting parts of a project is deploying it on your own server for the world to see. You will learn two different deployment options – one simple and the other more complex, but with more flexibility.Coupon included to get 90% off video lessons, jupyter notebooks, and source codeWhen purchasing this book, you’ll receive a coupon to get access to the following digital material for just $5:12 hours of video tutorials covering the entire book13 Jupyter NotebooksAll production code for the dashboardTechnologies usedAll code for developing the dashboard will be done using PythonPandas will be used extensively for analyzing and transforming dataStatsmodels will be used for smoothingScipy will be used for building the models for coronavirus cases and parameter optimizationMatplotlib will be used in the notebooks for static visualizationsPlotly will be used for interactive data visualizations that appear in the dashboardDash will be used for building the dashboard itselfHTML/CSS will be used together with Dash to customize components of the dashboardYou’ll learn how to setup your own Linux Ubuntu server to run your dashboard
محصولات مرتبط

-12%
خرید و دانلود نسخه کامل کتاب QuickBooks Online For Dummies, 2026 Edition
قیمت اصلی 3,703,700 تومان بود.3,248,700 تومانقیمت فعلی 3,248,700 تومان است.
-44%
خرید و دانلود نسخه کامل کتاب Enterprise Ontology: A Human-Centric Approach to Understanding the Essence of Organisation (The Enterprise Engineering Series)
قیمت اصلی 1,038,700 تومان بود.583,700 تومانقیمت فعلی 583,700 تومان است.
-12%
خرید و دانلود نسخه کامل کتاب LLM Engineer’s Handbook: Master the art of engineering large language models from concept to production
قیمت اصلی 3,703,700 تومان بود.3,248,700 تومانقیمت فعلی 3,248,700 تومان است.
-12%
خرید و دانلود نسخه کامل کتاب Database Internals: A Deep Dive into How Distributed Data Systems Work 1st Edition
قیمت اصلی 3,703,700 تومان بود.3,248,700 تومانقیمت فعلی 3,248,700 تومان است.
-18%
خرید و دانلود نسخه کامل کتاب The Scaling Era: An Oral History of AI, 2019–2025
قیمت اصلی 2,558,400 تومان بود.2,103,400 تومانقیمت فعلی 2,103,400 تومان است.
-42%
خرید و دانلود نسخه کامل کتاب The AI Workshop: The Complete Beginner’s Guide to AI: Your A-Z Guide to Mastering Artificial Intelligence for Life, Work, and Business—No Coding Required
قیمت اصلی 1,072,500 تومان بود.617,500 تومانقیمت فعلی 617,500 تومان است.
-42%
خرید و دانلود نسخه کامل کتاب Invest Smarter with AI: A Practical Guide to Long-Term Investing, Financial Planning, and Building Wealth
قیمت اصلی 1,072,500 تومان بود.617,500 تومانقیمت فعلی 617,500 تومان است.
-12%
نقد و بررسیها
هنوز بررسیای ثبت نشده است.